In my line of work, I always hear people talk about Willingness to Pay (or WTP for short), but it is always used incorrectly. The most interesting response I got when I asked for an explanation of WTP was: “Elasticity”. Although the concepts are related to one another, they are not the same. So why not break down WTP and elasticity by talking about one of my favorite things: Beer!
What Is Willingness To Pay?
Willingness to Pay is an economic model used to understand customer behavior for a given product or service. The underlying assumption is that every individual customer has a maximum price they are willing to pay under specific circumstances.
We can think about WTP as a dollar figure. If prices are lower than the customer’s WTP, there is a strong likelihood that they will make a purchase. However, if prices are higher, the customer will probably walk away.
Imagine you’re at a baseball game on a hot summer’s day and you get a hankering for a cold beer. For those of you who have been to a baseball game recently, you know that the cost of a cold one will run you into the double digits. Now, I am a big fan of beer, so I don’t mind paying double-digit prices. If my WTP is $13 and the concession price is $10, I am buying one (maybe even two). My friend Joe, however, is less of a beer enthusiast and is only willing to pay $8. He will probably pass on spending $10 and wait until we go to the liquor store, where beers are $5.
Notice:
1. Even though Joe and I were at the same baseball game, our WTP was different. Why? Not all customers are created equal.
2. Beer at ballparks is expensive! Why? Cost to serve aside, ballparks know that customer WTP is higher when you factor in the experience of watching the ball game, especially on a hot summer’s day. They take advantage of that higher WTP and (successfully) charge more.
Now, this is a bit of an unrealistic example because WTP is never based on just one or two individuals. Again, not all customers are created equal. Ask 100 people what their WTP for beer is and you will get 10 or 20 different answers. Thus, it is important to estimate WTP at both the individual and population level. To do this, use individual WTP and extrapolate it to represent population WTP.
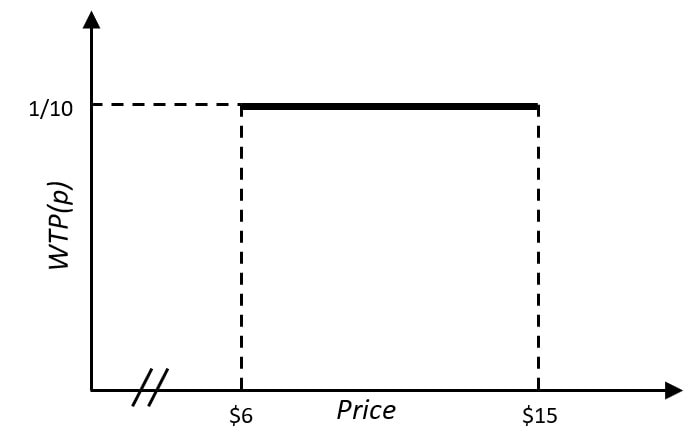
For example, if the stadium had a capacity of 50,000 people and WTP was evenly distributed amongst 10 price points ($6 to $15), we would have a WTP function that looks something like this:
There are exactly 5,000 people (1/10 of 50,000) willing to buy beer at each price point. At $6, everyone would be willing to buy a beer because everyone’s stated WTP is $6 or higher. The demand for beer would be 50,000 – the entire stadium! However, if the price of beer was $15, demand drops to 5,000 because only 1/10 of people have a WTP of $15.
By charging $10 for a beer, the stadium leaves money on the table for certain customers, like myself, who would be willing to pay $3 more for beer. The stadium also loses on sales for certain customers, like my friend Joe, who would pay at most $8 for beer.
WTP And Demand
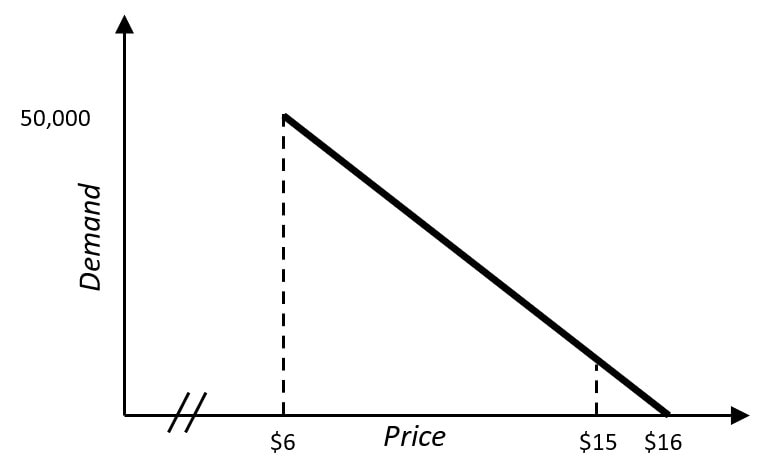
Notice the relationship between the price of beer and demand for beer. In general, as price increases, demand decreases. Using this insight, we can create a demand curve as a function of WTP to estimate how the demand for beer changes at different price points.
We see that as the price for beer increases (x-axis), the demand for beer decreases (y-axis). In fact, there would be zero demand if the price of beer was set to $16. That is because it falls outside the WTP range. No customer is willing to pay more than $15.
For all you math fans out there, moving from WTP to demand can be summarized by the following relationship:
So in our example, we would get:
WTP And Price Elasticity
Now that we have a demand curve, we can use it to calculate price elasticity – another crucial component in strategic pricing. Many people use price elasticity and WTP interchangeably, but to be clear, they are not the same thing. Price elasticity is a measure of how sensitive demand is in relation to price; WTP is the maximum price for an individual customer.
Using a single log-log model, we can estimate the elasticity for beer at a baseball game to be -2.19. We can thus assume that for every 1% increase in the price of beer, we would expect the demand to fall by 2.19%.
Thanks to WTP and price elasticity, the stadium knows what price to set their beers and how future price changes may affect demand – both at the individual and population level. No longer will they leave money on the table or lose sales due to poor pricing.
Now, this is a rather naive example that assumes a uniform WTP function and a linear demand curve. Unfortunately, life is never that simple. In reality, price differs by customer, channel, offering, and the list goes on and on. To get a true reading on WTP, you must conduct market research and segment customers based on similar attributes. That way, you get a more accurate representation of price expectations versus a uniform assumption.
Mixing It All Together
Understand customer WTP to charge more for the value you deliver and maximize/profits! It should not be a surprise to beer companies that WTP is higher at the ballpark than the liquor store. WTP is a function of customer and circumstance. I mean, are you willing to pay $10 for beer at the liquor store too? I’m not.
Another way to maximize revenue and profitability is to think about mix as a function of WTP. When most people think about mix, they think about their internal product mix and how to gradually upscale and upsell customers into higher-priced or margin items. Though this method can be effective, there is another way to think about it. A WTP approach to mix focuses on targeting direct channels, customers, and opportunities where there is a natural transition towards offerings with higher prices and margins. By optimizing your mix, you optimize your revenue.
ABOUT THE AUTHOR Michael Stanisz is a Partner at Revenue Management Labs. Revenue Management Labs help companies develop and execute practical solutions to maximize long-term revenue and profitability. Connect with Michael at mstanisz@revenueml.com


