It’s that time of year again—kind of? Given the current state of the world amidst the Coronavirus pandemic, the holidays will look quite a bit different this year, both for consumers and businesses. However, one thing that hasn’t changed is the domination of Christmas trade promotions! And lots of them!
Here at the Revenue Management Labs offices, we got to talking about these holiday promotions and how effective they actually are. Now you may be scratching your head wondering, “How could I NOT carry out a trade promotion during the festive season when everyone else is doing it?” We have an answer that could save you a few headaches and maximize your profit margins.
Let’s take a look inside how trade promotions work. There are basically two schools of thought on this issue:
Promoting During Peak Season is a Waste of Time
According to this premise, since customer behaviour shifts during peak seasons such as Christmas, it can be helpful to allow the spending to speak for itself. Since customer purchasing habits naturally rise during these peaks, it is best to capitalize on the customer’s willingness to pay in order to maximize margins.
Promoting During Peak Season is Essential
The argument here is simple: during peak season, it’s important to take advantage of the incrementality that reaches its height around holidays—and since everyone else is doing it, you HAVE to as well!
Now that we’ve seen the two arguments, we must decide which we agree with more. From my perspective, it really depends. While both strategies are valid and have their tidbits of wisdom, it is important to understand when and where to use them in order to drive incremental volume and optimize your pricing strategy.
How to Calculate the Baseline
Most people dealing with trade promotions focus on the baseline. What is the baseline you may ask? There are many cases where the baseline can be easily calculated. Take, for example, a typical grocery store chain as they sell a specific brand of cookies. In this environment, there is loads of historical data that allows you to have visibility on how historical pricing has impacted sales.
When taken together, all these factors can help build a robust baseline. It is essential for a business to understand their baseline so that they can effectively benchmark and decide on either a “Steady State” or a “Do Nothing” approach.
If the “Do Nothing” run-rate for my cookie brand is 100 units/week for the month leading up to the holidays, and 150 units the week before Christmas, it is important that we don’t consider those 50 units as incremental volume.
When establishing your pricing benchmarks, it is integral to take specific events into consideration that could skew your results. A perfect example can be seen in the way chip sales rise during the week of Superbowl—this scenario calls into question the natural incrementally that should be calculated into the baseline.
As everyone knows, the Sales and Finance teams love to debate what actually constitutes the baseline. As we see from the case above, it is often difficult to calculate and control a baseline—what if a promotion ALWAYS happens the same time every year and there is no control? Many pricing systems use moving averages to calculate baselines, which can be a problematic technique. Alternatively, it can be helpful to consider as a company if it even makes sense to hold such a promotion in the first place.
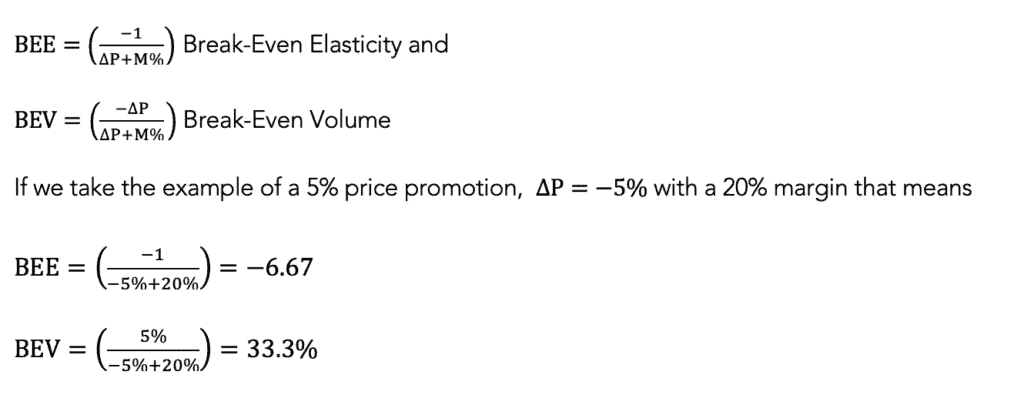
In this situation, the key metric to consider is the lift garnered from any additional promotion. A great approach is to work backwards and see what the Break-Even Elasticity needs to be in order to stay margin neutral.
The Break-Even Elasticity Equation
As you implement this equation, keep in mind that the result will vary greatly based on margin.
In this case, to break-even on our 5% price promotion, we would need a 33.3% increase in sales or a Break-Even Elasticity of -6.33.
Now regardless of your baseline, you can ask yourself,
- “Is this a realistic elasticity?”
- “Have we seen results like this in the past?”
- “Are we even close?”
Let’s extrapolate the example with 20% margin: For a 10% price promotion it would be -10.00. As you can see, these are starting to get quite high. I can tell you from experience a -10 elasticity doesn’t come along everyday.
What about a product with 60% margin? A 5% promotion has a BEE of -1.81. At 10%, it would have a BEE of -2. To get a BEE as high as we saw above of -6.67, we would need to discount by 45%!
Now I know some of you will tell me there is a more precise way to carry out the calculation, and though I agree, the trick outlined above is a simple method to get you 80% of the way to making a good promotional decision!
The Simple Approach of Break-Even Elasticity
So, instead of distracting yourself by debating incrementality and baselines, take the simple approach that I’ve outlined above by checking the Break-Even Elasticity. If the number is way too high, you’re probably facing the reality of a bad promotion. However, if the number is within an appropriate range, then you can take the next step and debate baselines.
At the end of the day, I realize that there are other aspects to consider outside of just profits, such as supporting business partners and analyzing competitive landscapes. While you keep those other aspects in mind, it can be extremely helpful to check the Break-Even Elasticity and negotiate hard to get a win-win program in place!
ABOUT THE AUTHOR Michael Stanisz is a Partner at Revenue Management Labs. Revenue Management Labs help companies develop and execute practical solutions to maximize long-term revenue and profitability. Connect with Michael at mstanisz@revenueml.com


