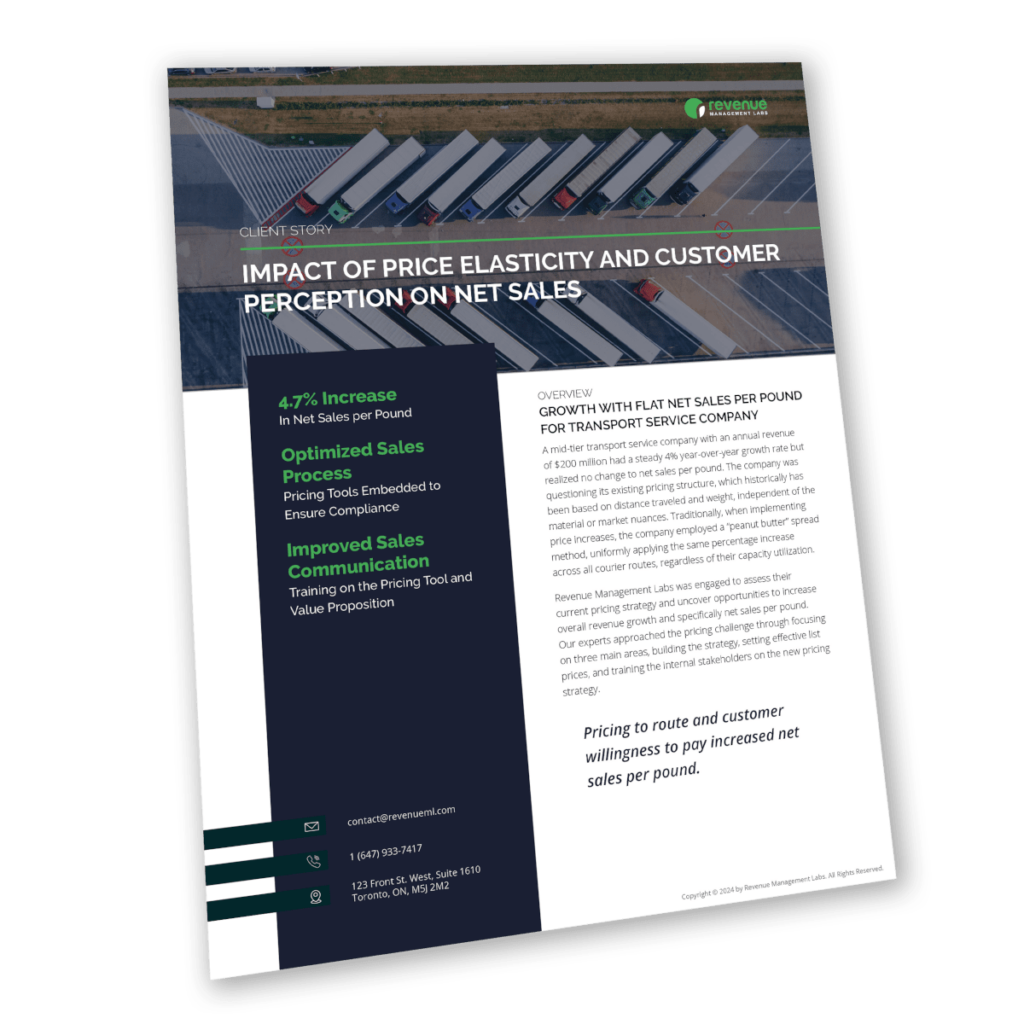
Pricing to route and customer willingness to pay increased net sales per pound.
A mid-tier transport service company with an annual revenue of $200 million had a steady 4% year-over-year growth rate but realized no change to net sales per pound. The company was questioning its existing pricing structure, which historically has been based on distance traveled and weight, independent of the material or market nuances. Traditionally, when implementing price increases, the company employed a “peanut butter” spread method, uniformly applying the same percentage increase across all courier routes, regardless of their capacity utilization.
Revenue Management Labs was engaged to assess their current pricing strategy and uncover opportunities to increase overall revenue growth and specifically net sales per pound. Our experts approached the pricing challenge through focusing on three main areas, building the strategy, setting effective list prices, and training the internal stakeholders on the new pricing strategy.
The transport company had implemented frequent, regular price increases of 0.5% over three quarters but observed no change to net sales per pound. This discrepancy raised a critical issue that demands attention and strategic intervention. When we see flat sales with a price increase, typically we first examine price elasticity and have developed a demand sensitivity tool to assess whether customers are highly responsive to price changes.
The company was also applying price increases across all courier routes but were aware that their back haul route was running at half the capacity of another route, head haul. That immediately flags an opportunity to set prices to increase capacity in under utilized route. More generally, there may be an opportunity to segment pricing according to the route.
Pricing Tools Embedded to Ensure Compliance

Review the advanced analytics behind our pricing strategy and the increase in revenue.
The experts at Revenue Management Labs developed a pricing strategy that independently priced routes and based those list prices on willingness to pay and new customer-relevant offerings add-ons for additional charges the customer perceived as added value.
The second part to the pricing solution focused on implementation. Revenue Management Labs completed training on each part of the pricing tool and effective sales communication. Training internal sales on pricing tools enabled the company to align internal stakeholders on pricing and achieve consistent pricing. Sales communication training on the list pricing changes and the value-added offerings resulted in increased sales effectiveness, which had an immediate impact on revenue.
Our approach to flat net sales per pound with overall growth had two parts: analyzing the current market conditions and then using financial modelling to set prices. The team used a demand share tool to assess the current strategy of uniform pricing increases across all routes through analyzing how each route reacted to price increases. The analysis revealed variation price elasticity across routes, with opportunities on the back haul and head haul routes to implement price per pound.
The next step applied a willingness to pay model to each route to establish the correct list price. The analysis also uncovered value-added offerings that were introduced on a for-charge basis to enhance overall customer value.
For a detailed review of the pricing methodology and data analysis,
download the full case study on price elasticity for transport.
Following the comprehensive project aimed at reevaluating and optimizing the pricing strategy for the mid-tier Transport Service company, the client experienced an immediate 4.7% increase in net sales per pound.
The positive impact on net sales per pound suggests a successful alignment of the pricing strategy with market dynamics. By incorporating a demand sensitivity tool and a model to evaluate customer willingness to pay, the company implemented a nuanced understanding of market conditions and customer preferences, enabling them to optimize pricing for increased revenue.
The demand sensitivity tool played a pivotal role in identifying routes that were more price-sensitive, allowing the company to tailor pricing strategies based on specific market conditions. This route-specific optimization contributed to the overall improvement in net sales per pound.
The success of the project in driving a substantial increase in net sales per pound sets the stage for a sustainable growth trajectory. The optimized pricing strategy, supported by data-driven insights, equips the company to navigate market fluctuations and continue on a path of steady and profitable expansion.
We are here to help you achieve profitable revenue growth

We will cover the full results from our 2024 Executive Pricing Survey. See how you compare to your competitors both in past performance and for 2024 pricing strategy.