
Summary
Political campaigns are missing revenue opportunities hiding in plain sight. This article explores how anchoring and pricing psychology influence donor behavior using the 2016 U.S. presidential race as a case study.
With the United States Presidential race well underway, there is no shortage of entertainment in the headlines. Amongst the chaos you have every analyst and political scientist scrambling to figure out what the odds are of each candidate becoming the leader of the most powerful nation in the world. While every vote surely counts, so too does every dollar that voters are contributing to the extravagant campaigns; upwards of $500M over more then one million individual contributions. With hundreds of millions of dollars at stake the revenue manager in me could not help but ask? What is the best pricing strategy to solicit the maximum contributions?
Now one may argue that no pricing strategy exists when soliciting campaign donations but given the era of online contributions it is clearly evident that several revenue management concepts are used by candidate’s. Albeit naïve to assume that a pricing strategy can sway who individuals donate to, the more interesting question is “What pricing strategies can candidate’s use to extract value from contributors and maximize the willingness to donate”?
Examining the “big four” candidate’s (Clinton, Saunders, Trump, Cruz) websites respectively each candidate provides a tiered approach to contributing.
Website donation amounts by candidate with most frequent donation amount highlighted
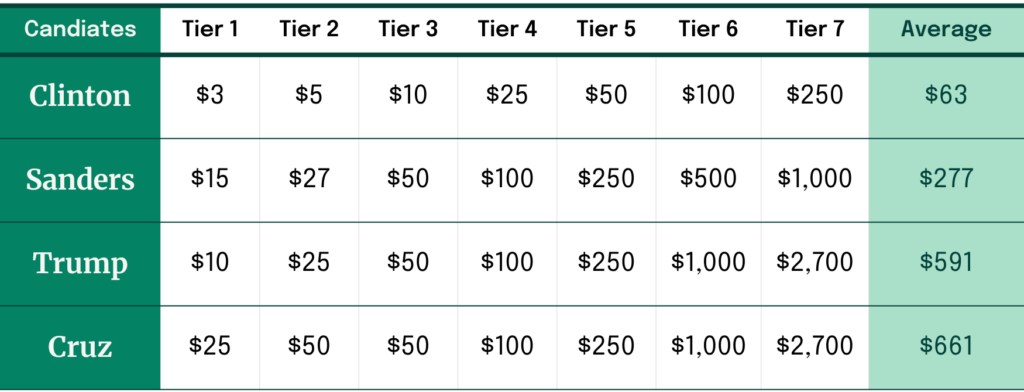
What is interesting to note right away is the significant difference between the lowest and highest pre-selected contribution denomination.
Here is where we should introduce anchoring. Give a description of it (WHAT IS IT), show how Clinton is anchoring low vs. others going high. Maybe talk about because of party demos (is. Democrats are poorer. Therefore, they choose to do this) and compare AVG donation. I would expect the lower anchors (Clinton) to be lower. Bring back to example in real life… ie. Grocery store/ online subscription etc.
NEXT talk about steepness of curve (price curve) and price gaps. First introduce the idea in a sentence or two. What is a price curve? Why should I care (customer trade up and down based on value)? So, look at the variance between buckets and draw a demand curve (# of donations) vs. the variance to see if people swing to the higher buckets if there is a small or large gap (would be interesting if the results showed moving into the most frequent bucket). Bring back to real life… cereal/beer/ etc.
Use below to add to anchoring and price gaps comments of mine above.
What happens here is often referred to as Anchoring and refers to the human behaviour bias that causes us to rely too heavily (or anchor) on the first pieces of information that we receive, which in this case are the ‘normal’ donation amounts provided. This is the same phenomenon employed by countless restaurants that place their unreasonably expensive options in highly visible locations on their menu to make their remaining options seem extremely reasonable in price. For the time being we will ignore the other psychological A/B testing those candidates are conducting on their sites around the impact that the picture they use, their colour scheme and slogans have on visitor to donor conversion, and instead explore how this so called Anchoring impacts your donation amount.
Now that we have a set list of donation amounts to choose from, countless studies on human behaviour have given us insight into a few different things. As an example, a study conducted by the ESSEC Business School (input reference) concluded that people tend to anchor from the lowest donation option, meaning that increasing your lowest amount also increases the average donation size. We’re not saying that people usually select the lowest donation amount (in fact only 8% of all donors across all candidates donated that amount, regardless of what the amount was), but they most often use this as their reference point, which comes as no surprise as it’s the first option on the page (one wonders why none of the candidates have ordered their donation buttons from highest to lowest in an attempt to influence this). This then raises the question on the impact to Clinton whose lowest donation button is $3 vs. Cruz who starts at $25 ($25 is the fourth option on Clinton’s page).
The second thing that this study (input reference) showed us was that the steepness of donation options (gap between lowest & highest amounts) impacts how much people donate. The larger the gap, meaning the higher the highest amount, the more people tended to donate. This is supported by what we know as the Contrast effect which makes smaller amounts seem even smaller when placed next to big numbers, and the same vice versa. Again, using Clinton, we see that her largest donation option is $250, whereas Trump and Cruz instead have $250 as a middle option before capping at $2,700 (the legal maximum that any one person can contribute). What kind of impact does this have on their donation levels?
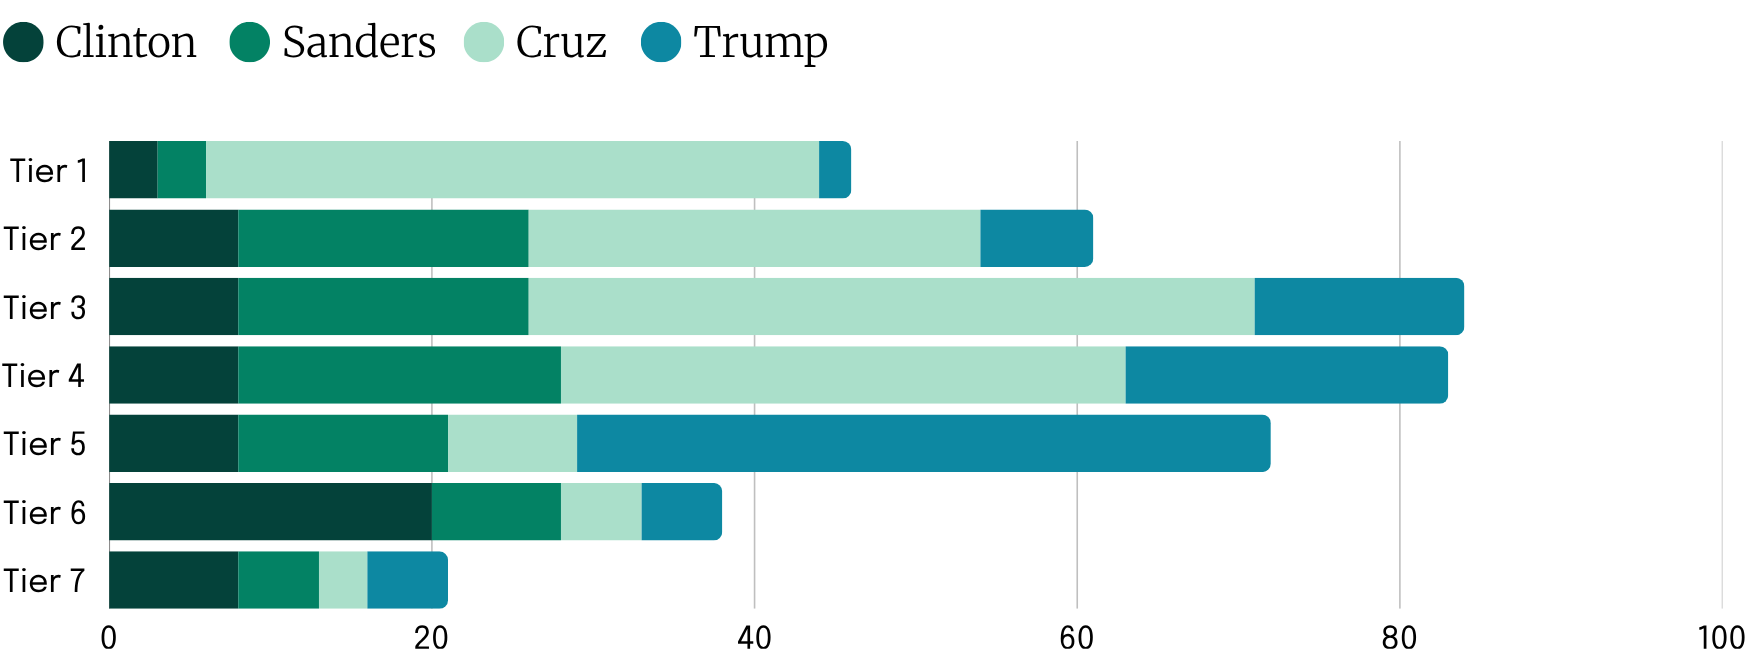
Percentage of donations by option tier per candidate
The results
While I warn that this may not be a perfect science, and some assumptions had to be made based on levels of visibility, the results reflect what would have been the initial predictions heading in. Based on only donations received for the prescribed amounts on their websites, Clinton’s average donation was $69 (195K donations) vs. $97 (314K donations), $138 (204K donations) and $393 (4K donations) for Sanders, Cruz and Trump respectively. What also comes as no surprise, is that people will tend to pick an amount somewhere in the middle, as they would often perceive this as the ‘average’ donation based on the scale of donation options provided. This again would have impacted Clinton, whose middle three options were $10-$50, whereas every other candidate had their middle options starting from at least $50 and going up to $500.
The comments about picking the middle should go well with the anchoring. For me the graph doesn’t add anything. I am not sure about the 2700 with Hillary… might give us the wrong info.
For Clinton, one known upside of starting her donation scale so low is that we do know that the amount of the lowest donation does impact donation rate. Unfortunately for us we don’t have the visibility to confirm the website visitor to donor conversion rate for each of the candidates, but it can be assumed that the impact would be minimized based on the fact that most visitors to the donation page have already made the decision to donate. Her total donations are also similar in quantity to Cruz, who has the highest starting donation amount, while significantly fewer donations than Sanders, so it’s difficult to conclude based on this information that this strategy helped her.
Number of maximum donations ($2,700)
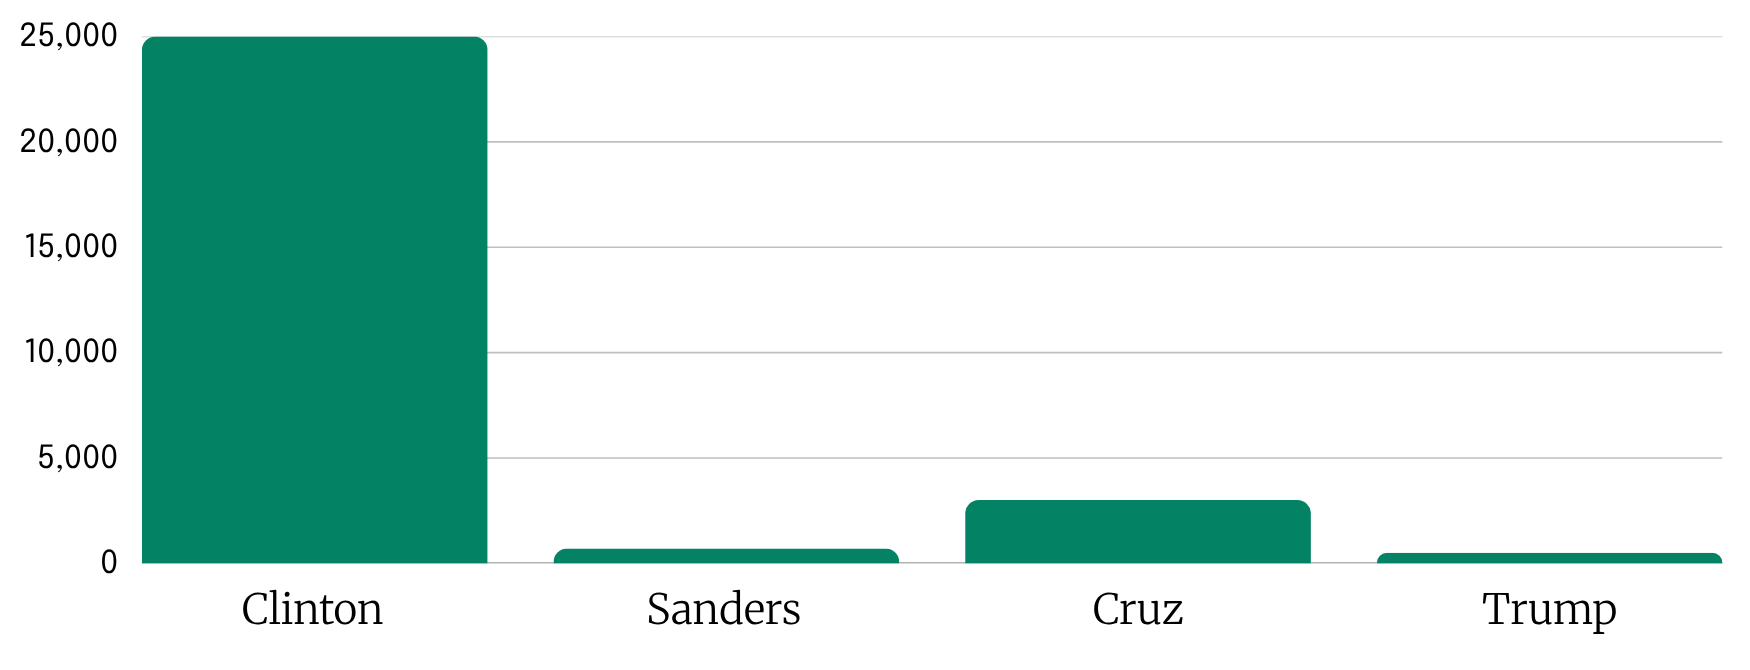
Overall, Clinton appears to have taken a very different strategy to her donation page than her counterparts. She has missed the opportunity to take advantage of both Anchoring and Contrast biases and it appears to have negatively impacted her donation amounts. How much money she left on the table we won’t know for certain, but based on…..(still working on developing accurate value, assuming she had different options). But maybe at the end of the day she doesn’t care. Maybe she knows that she already has a massive following of elite society that goes out of their way to donate the max contribution even though it’s not an option on her page (only Jeb Bush had a higher percentage of his donations be for the maximum amount, with 8K of his 30K donations being for that amount – confirm Rubio % of max donations), so maybe this was a calculated risk to come across as a politician of the people, reaching out to a different demographic that can only afford to contribute $3-$5 at a time. Or maybe this was a miss.