Filling in gaps in customer and market data were foundational to assessing the feasibility of a price increase.
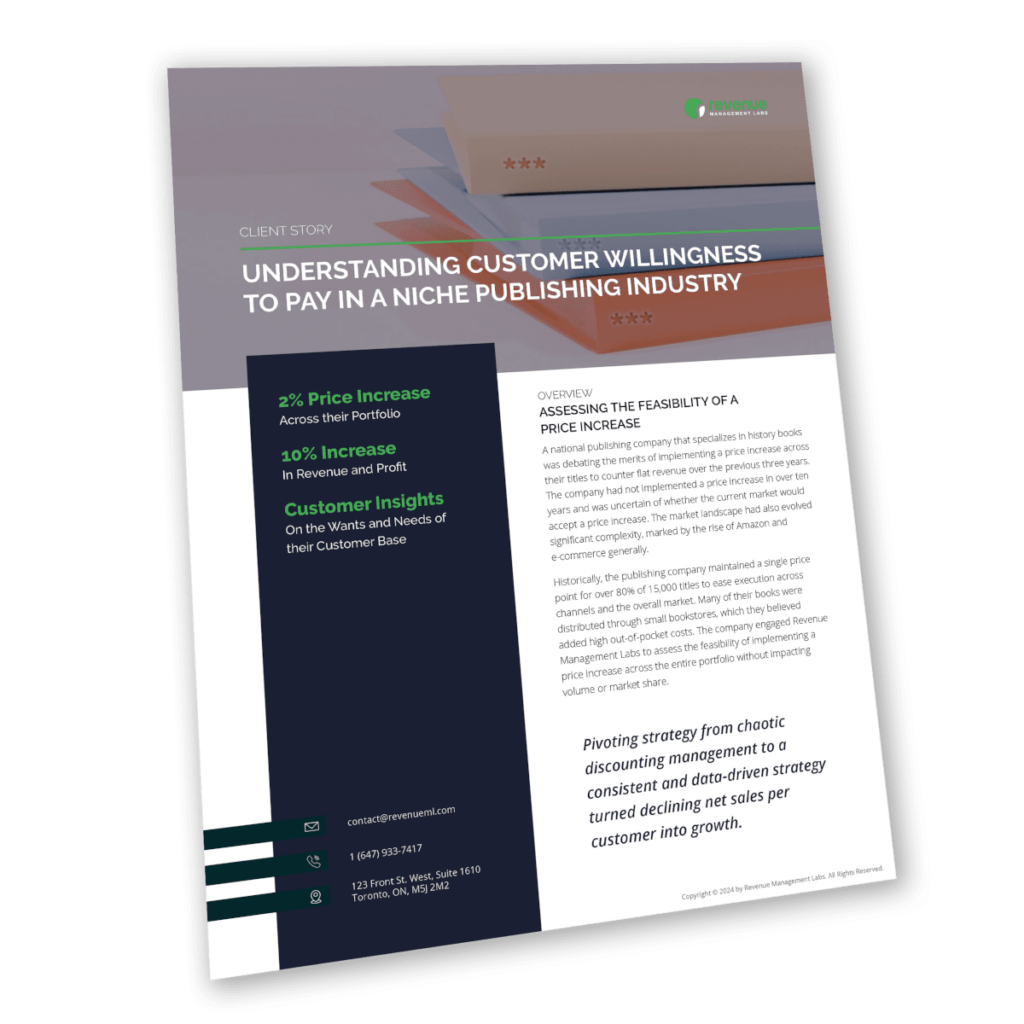
A national publishing company that specializes in history books was debating the merits of implementing a price increase across their titles to counter flat revenue over the previous three years. The company had not implemented a price increase in over ten years and was uncertain of whether the current market would accept a price increase. The market landscape had also evolved significant complexity, marked by the rise of Amazon and e-commerce generally.
Historically, the publishing company maintained a single price point for over 80% of 15,000 titles to ease execution across channels and the overall market. Many of their books were distributed through small bookstores, which they believed added high out-of-pocket costs. The company engaged Revenue Management Labs to assess the feasibility of implementing a price increase across the entire portfolio without impacting volume or market share.
The publishing company wanted to assess the feasibility of a price increase, which would typically involve analyzing customer point-of-sale data, history of price changes, and corresponding customer feedback to measure market sensitivity. Limited access to data as well as niche market, and limited direct competition posed substantial hurdles to following a typical assessment. Instead, Revenue Management Labs developed a custom solution to determine customers’ willingness to pay.
Across their Portfolio
In Revenue and Profit
On the Wants and Needs of their Customer Base

Review the advanced analytics behind our pricing strategy and the increase in revenue.
In response to the limited data and niche market with minimal direct competition, Revenue Management Labs first developed a custom process and analysis. Our goal was to determine the factors influencing a book purchase decision, the customer’s willingness to pay, and finally to measure whether the company was value advantaged, which would allow for a price increase, or disadvantaged.
The final recommendation was to increase the price by $2.00 from an initial retail price point of $21.99, at which point the increase would fuel revenue growth without impacting volume or market share. Revenue Management Labs also provided the publishing company with extensive customer insights from the online surveys and focus groups during the data collection phase of the project.
At Revenue Management Labs, we base our pricing strategy on data-driven insights rather than an out-of-the-box solution. In the case of history book publisher, the niche market and limited direct competition make gathering relevant data crucial to the impact of the pricing strategy. Data from other book publishers may or may not be transferable and would decrease the reliability of the pricing strategy.
The revenue consultants at Revenue Management Labs landed on online surveys and focus groups as the two most effective and targeted means to gather information about the factors influencing a book purchase decision and to determine the customer willingness to pay. Then, value mapping sessions were used to assess how customers view the company’s product as compared to the competition’s.
For a detailed review of the pricing methodology and data analysis,
download the full case study on price optimization for publishers.
The national publishing company experienced a transformative impact on its pricing strategy, consumer insights, and overall business performance. Empowered with the data-driven revenue and consumer insights, the company had the confidence to implement a price increase of two dollars for the first time in ten years. As a result, they saw more than 10% increase in revenue without adversely impacting volume or market share.
The consumer and market research conducted by Revenue Management Labs filled a sizable gap in the publishing company’s understanding of customer wants and needs. The consumers insights place the company in an improved position to make informed decisions aligned with market expectations.
We are here to help you achieve profitable revenue growth

We will cover the full results from our 2024 Executive Pricing Survey. See how you compare to your competitors both in past performance and for 2024 pricing strategy.