After three quarters of flat results, the same company finally broke through. A demand-led approach, pricing each lane to what it could actually bear and then building the discipline to hold it, lifted net sales per pound 4.7% and unlocked an estimated $9M in annual revenue.
4.7%
increase in net sales per pound
18%
of customers willing to pay over $2.00/lb
43%
back haul utilization unlocked for optimization
The Situation
A pricing structure built for simplicity, not performance
A mid-tier transport services company generating $200M in annual revenue had a pricing model that made operational sense for years: charge by distance and weight, apply the same rate across the board, and pass increases uniformly when costs went up.
After years of applying the same formula, the company had begun to question whether their pricing structure was actually working — and the numbers were starting to confirm those doubts.
Every Courier Lane received the same percentage increase regardless of how full those lanes were running or how price-sensitive customers on those routes actually were. Meanwhile, Back Haul capacity utilisation was running at roughly half the rate of Head Haul — empty trucks headed back were a recurring cost the pricing structure did nothing to address.
Every lane received the same percent increase, regardless of utilisation or competitive dynamics. The approach was simple to execute, but it was leaving significant revenue on the table.
The Challenge
Price increases with no change in outcome
Despite regular price increases, net sales per pound had remained essentially flat over three consecutive quarters. The increases were happening on paper — but competitive erosion, customer churn on sensitive lanes, and deteriorating discount management were absorbing all the gains. Three quarters of applied increases had produced zero net improvement in revenue per unit.
The root cause wasn’t the size of the increases. It was that every lane was being treated identically despite behaving completely differently. Some routes could absorb a price move without blinking. Others would bleed volume from the same move. Without knowing which was which, every increase was a guess — and the results showed it.
The company needed to answer two questions it had never formally asked: which routes could absorb a price increase, and which ones would lose volume if pushed too hard?
Three quarters of consistent price increases produced no measurable change in net sales per pound. The problem wasn’t effort — it was that the approach had no way to distinguish between a lane that could take the increase and one that couldn’t.
Net sales per pound vs. price increase applied

The RML Approach
Strategy, structure, and execution, in that order
Revenue Management Labs organized the engagement across three interdependent phases. Each phase was designed to feed the next, ensuring that any price increase was grounded in data before it was ever communicated to a customer.
PHASE 1
Build the strategy
Determine where the increase should land, how large it should be, and which lanes can bear it.
PHASE 2
Set list price
Use willingness-to-pay modeling to set defensible list prices and structure discounts with discipline.
PHASE 3
Execute & sustain
Train the sales team to communicate value and build the tools into the sales process for long-term compliance.
Phase 1: Find where the increase should land
The first step was building a demand share tool to measure how each lane actually responded to price movement. The output immediately invalidated the uniform pricing assumption: lane-level demand sensitivity varied dramatically, and the numbers made that impossible to ignore.
A 1% price increase applied to Lane A151 reduced demand share by just 1.4%. The same increase applied to Lane A556 reduced demand share by 5.3% — nearly four times the impact from an identical move. Lanes A818 and A363 fell between those extremes at −3.4% and −5.0% respectively. These weren’t minor variations. They were the difference between a price increase that holds and one that bleeds volume.
The sensitivity analysis also revealed that Back Haul and Head Haul trips had fundamentally different price thresholds. For lane A143, Back Haul demand dropped sharply after $1.25 per pound — informing a targeted strategy to improve fill rates by pricing those seats more competitively in specific markets, and converting otherwise-empty capacity into revenue.
A factor of nearly 4x across lanes — made the case for a segmented approach impossible to argue against. Uniform increases were always going to produce uneven results, because the lanes were never uniform to begin with.
Lane demand share vs. price per pound

Phase 2: Set a defensible list price
With lane-level demand sensitivity established, the team built a willingness-to-pay model for each individual lane. Rather than applying an industry rule-of-thumb, the model surfaced the actual price distribution each customer segment would tolerate.
For Lane B4432, the analysis found that 18% of customers were willing to pay above $2.00 per pound — a threshold the company had never tested. Without this data, any list price above $1.70 would have felt like a risk. With it, the team had the confidence to set a higher list price while tailoring discounts to protect volume on the price-sensitive portion of the book.
To give sales reps the language to defend those new price points in customer conversations, the team developed three value-added offerings tied directly to what customers were already paying for: Cubing (capturing value for space-inefficient loads), Fragile item handling (tying incremental cost to incremental charge), and Guaranteed timing (monetising urgency and schedule certainty).
Without this data, any list price above $1.70 would have felt like a risk. With it, the team had the evidence to push further and the justification to make it stick with customers.
Willingness to pay distribution: lane B4432

Phase 3: Build it into how the team sells
A pricing strategy that lives in a spreadsheet dies in the field. RML worked directly with the client’s internal sales team to build proficiency with all three analytical tools — and critically, to give reps the language to communicate value and defend the new list prices in customer conversations.
The client then embedded the demand sensitivity tool, the willingness-to-pay model, and the demand share analysis into their standard sales process. Building the tools into workflow — not just handing them over — was the mechanism that turned a one-time project into a durable capability.
The difference between a pricing engagement that holds and one that fades is whether the team who owns the customer relationship can use the tools confidently. That meant training, not just delivery.
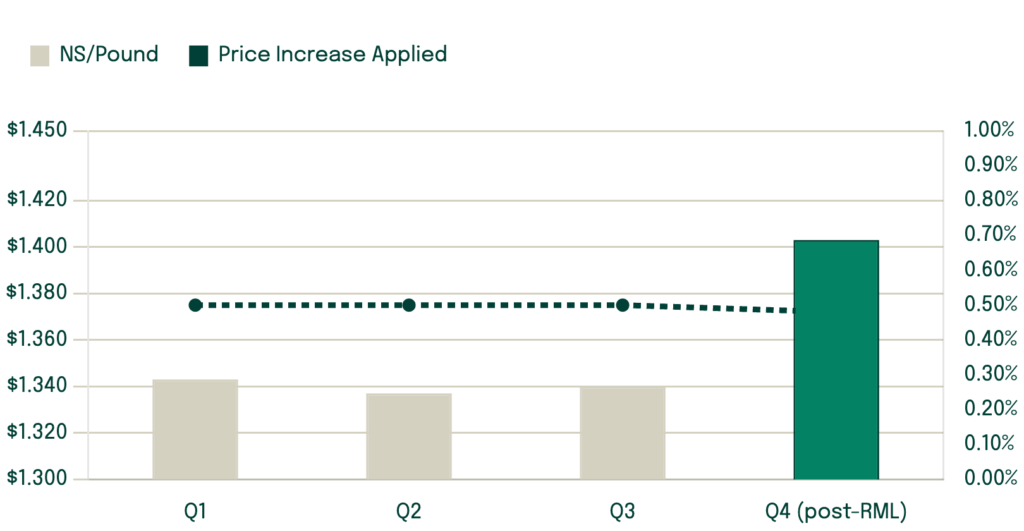
Net sales per pound rose from $1.340 to $1.403 in Q4 — while the applied price increase rate decreased. The number finally moved, not because they pushed harder, but because they pushed smarter.
Net Sales Per Pound: Before and After
The result
A $9M swing from a smarter approach to price increases
Following the engagement, the company saw a 4.7% increase in net sales per pound — from $1.340 to $1.403 in Q4. This was meaningful not because 4.7% is a large number in isolation, but because for three consecutive quarters beforehand, the number had not moved at all. The same company, applying the same discipline of regular increases, had finally broken through.
The underlying reason the improvement held was structural. The company didn’t apply another one-size-fits-all increase. They applied differentiated increases informed by lane-level demand sensitivity, set list prices against real willingness-to-pay data, and gave their sales team a framework for managing discounts rather than guessing at them.
Back Haul utilisation also improved as rates were repositioned in markets where the pricing analysis had identified room to compete more aggressively without sacrificing margin on higher-capacity lanes.
Net sales per pound rose to $1.403 in Q4 from $1.340, while the applied price increase rate declined. The improvement came from smarter strategy, not increased effort.